Do you know how to use Power BI or Tableau? Do not be a victim of technology.
https://lnkd.in/eKEaPGq
Visualization is big. Kellogg’s is one of the largest users of Tableau in Michigan & Tableau is owned by Salesforce. Salesforce is huge & is worth $220B. PowerBI is owned by Microsoft which is even huger than Salesforce & MSFT is worth almost $2,000,000,000,000 – that is $2 Trillion. PowerBI (MSFT) is playing catch-up but making significant strides. Tableau is the real deal. But so is Power BI. Students ask me which one will prevail in the market place? I have no idea but would you bet against a $2T company? Based on what I have seen, they both might be long term players in this space.
CIS 3640 (this is the 3rd of 4 classes in our Business Analytics minor) has added Tableau & Power BI.
Both Power BI & Tableau target the similar market – visualization & end-user BI. The consensus is that Power BI should be there in CIS 3640 for several reasons. One key reason is that Microsoft is making it free of charge, while Tableau is not. We will continue to monitor the market & adjust accordingly. In short, the current plan is to have Power BI in CIS 3640. Tableau is being added to a 3640 section as an “experiment”. Please let me know of disagree with any of this.
I had a student with a “Technology Skills” section on her resume. She (BA minor) listed all the things she learned in all her SCM and BA courses. During an interview, an employer asked her, do you really know how to do all this stuff? I would love to be asked that! As of today, what would a Technology Skills section on your resume look like?
Note: I have a few former students (not many) that lost their jobs during covid as they became victims of downsizing. If you asked me what was the key underlying theme, I would say they were weak on technology. Also, during covid, I had numerous employers ask for help finding talent because they were hiring like crazy. Kind of ironic, right?
The bottom line is that it really doesn’t matter which tool students learned (as long as there is industry evidence to support the tool selection). The two tools share so many similarities. Usually one should be able to transition from one tool to another with minimal learning.
If SCM students already know what tools they are going to be using at the internship or job, they might want to talk to talk to their CIS faculty. This will help them pick the desired course section. Otherwise, it is hard for us to predict what analytics & visualization tools each student will be using & which company they will end up working.
In our CIS 3640 class we focus on three major areas: (1) Advanced excel functions, Power Query, Power Pivot , and Data Models, (2) Excel Macros, and (3) Visualization.
We do our best to go in-depth in all these three areas. Based on the feedback we received from students (especially ISM majors), they are interested in learning about all three areas and found them helpful during their job search. However, it is not possible to talk about both Tableau and Power BI visualization because of the time limitation. Therefore, we decided to cover Power BI in one section and Tableau and Tableau data prep in the other section. As you know, ETL is one of the most important skills they need for visualization. Therefore, we always teach Power Pivot and Query, which are foundations for Power BI in both sections. There are 8 assignments in the class. At least two are about Power Query and Power Pivot and two about Visualization in Tableau or Power BI.
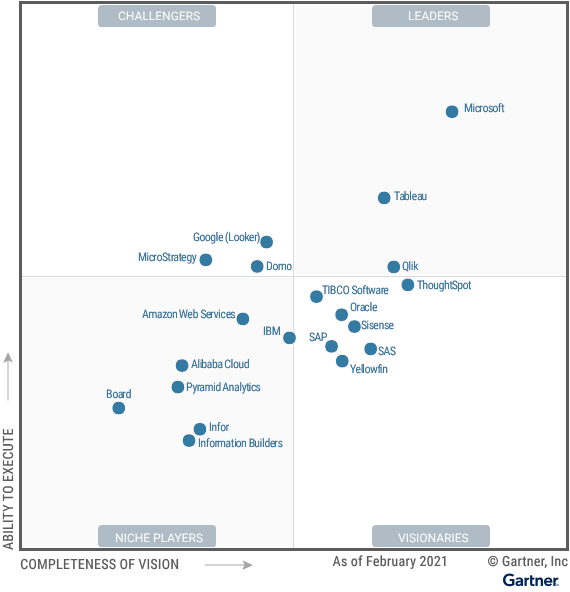
I personally would encourage students to have an open mind on tool usage. The whole reason of teaching both Tableau and Power BI in our curriculum is backed by industry evidence, rather than by one or two individual companies. Both visualization tools have been in the best quadrant (i.e., leaders-visionaries quadrant) of Gartner’s “magic quadrant” survey for analytics and business intelligence platforms for years. So, it is not true that Tableau is not used at many companies. Kellogg’s, for example, is basically a Tableau shop.
The bottom line is that it really doesn’t matter which tool students learned (as long as there is industry evidence to support the tool selection). The two tools share so many similarities. Usually one should be able to transition from one tool to another with minimal learning. It seems that the student’s experience in the email confirms that.
I think one way going forward is probably this:
If ISM students already know what tools they are going to be using at the internship or job, they might want to talk to us first before taking CIS 3640. This will help them pick the desired course section. Otherwise, it is hard for us to predict what analytics & visualization tools each student will be using and which company they will end up working.
What if you are a student that wishes to learn both Power BI and Tableau, but your instructor only covers one? Unfortunately covering both in one single class will not give either one a fair coverage. In the end, students won’t have good skills in visualization. This is the reason we offer two sections, one for each tool. The good news is that Power BI is a free download. Here is what I recommend students do:
- Download Power BI
- Go through the video tutorials of Power BI online (e.g., https://docs.microsoft.com/en-us/learn/powerplatform/power-bi)
- Work on class exercises and assignments in both Tableau and Power BI. Many things are available in both tools. That makes it possible to replicate certain parts of class exercises and assignments in Power BI.
Does your resume have this?…
-big data/analytics, database management, data mining, project management, SQL, Python, PMO, Tableau, Power BI, etc.
https://lnkd.in/eK7yQiRD
Also, not directly related…We used R in our data mining class about 5 years ago for three semesters, but students had a hard time understanding it. The language was not designed to be intuitive. It does not conform to many common syntax elements of a modern computer language, probably because it was designed by statisticians, not computer scientists. It didn’t work well when students were asked to learn the language and data mining algorithms at the same time. So, we dropped R and went for Rapidminer (drag-and-drop without programming).
Joseph Hungerman, CSM 1st degree connection1stCurrent Business Analyst – Future Business Architect3wComputer science basics, and any intros to languages should be part of the gen Ed business curriculum. Then by the time students get to data mining algorithms in a major / specialization, they should have a basic understanding. Definitely too dense to learn both at the same time. It’s the multitasking myth
I personally would encourage students to have an open mind on tool usage. The whole reason of teaching both Tableau and Power BI in our curriculum is backed by industry evidence. Both visualization tools have been in the best quadrant (i.e., leaders-visionaries quadrant) of Gartner’s “magic quadrant” survey for analytics and business intelligence platforms for years.
Josh Taban 1st degree connection1stJunior at the Fox School of Business studying Supply Chain Management and Marketing | PR at the Innovation and Entrepreneurship Institute (IEI)1moMy university gives us a free subscription to LinkedIn learning. I have been using it to fill the places I think are gaps in my scm/marketing degree. Over the summer I used it to learn spss, advanced Excel, power bi, and tableau. Such great tools! Great post!
Joseph Hungerman, CSM 1st degree connection1stCurrent Business Analyst – Future Business Architect1moI transitioned from SCM to tech over the past few years. Honestly it is an incredibly important set of skills. My ISM training in lean and TPS led me to a passion in Agile and Scrum. Once I learned how to program and automate it made all of my work easier. I realized that spreadsheets are evil. Basic skills that should be taught are Python (for the business focused) / R (for the academia focused), Power BI, and some OOP language basics in something like C# or Java. I skipped the opportunity to take C++ in the curriculum, but that’s too low level for what most SCM grads will face. SQL is an absolute must. There are all sorts of flavors of SQL, but training in an open source environment like MySql should cover the bases. Stick to open source / freeware. I was trained in SAS for my masters, but it is incredibly expensive and not widely adopted. I met with the leaders of my program to implore them to switch to Python.
Brian Smith 2nd degree connection2ndChief Operating Officer COO, CPO, CPIM at Buyers Products1moSime – we absolutely utilize Tableau and have been pre- Salesforce days. You are correct that this skill set it valuable. Turning data into information and doing it efficiently will continue to be important!
Dr. JoAnn Atkin 1st degree connection1stAssociate Professor of Marketing1moTechnology and tools are always changing/improving/advancing. The key, IMO, is the underlying reason for their use – why are we using them and what do they help us do? It’s about critical thinking and using data to solve business problems. To me, developing those skills is more important than mastery of a specific software program.
Aaron Lieto 1st degree connection1stVice President of Procurement at Covia3wI have used both. We use power bi and I saw the value enough to take the time to learn DAX and power pivot. As a stand-alone software I think Tableau is better. However, if I were selecting a solution for my own company I would select powerBI because the network effects of the Microsoft power platform make it far superior. The low code automation of power apps and power automate enable you to do really neat things when integrated with powerBI. You need the talent in your organization to unlock that power, as you rightly point out.
Kevin Boyer 1st degree connection1stAssociate Director – Value Optimization at Adept Packaging (Adept Group)1moTableau is a great tool for data visualization and easy to use. Most of these tools have free trials where you can just sign up and try them out with intuitive lessons online to get someone started. No matter what discipline you’re in nowadays you’re going to have to convey information too other parties and a lot of the platforms out there make it much easier
A while back, we made these points about CIS 2650 and the BA minor in general. Do these points still largely apply?…
CIS 2650 is not just a Python class, but instead a Python class for analytics. There is a difference there. In a traditional Python class, people teach Python straight for the whole semester with so much of syntax, data structure, software development, etc. That type of class is mostly designed for CIS and CS. What we do is different. It is Python in a popular analytics platform (more technically speaking, it is Python in Jupyter, which is an analytics platform that data science and business analytics programs do).
- We studied the top skills in analytics jobs & Python was among the top skills.
- The visualization libraries in Python can produce the kind of visualizations not available in Tableau & Power BI. Students will be able to differentiate themselves from other schools.
- Tableau & Power BI recently added Python or Python+Jupyter because certain Python analytics & visualization are not available in Tableau and Power BI. Using them together makes it a powerful analytics solution (e.g., the ability to transform visualization into implementable actions).
- All data scientists stress the importance of Python in analytics programs. Note, “data scientist” is one of the fastest growing career paths with escalating salaries because not enough people are good at this stuff.
- Python are “R” are both number one & two in analytics, but Python is easier to learn compared to R.
- Past experience in our SCM program (3+ semesters of experience in CIS 2650) shows that non-technical students (SCM, marketing, accounting, etc.) are able to handle the content that we designed.
- Python + Jupyter (or its variant) are used in Big Data (Hadoop, Microsoft Azure, Amazon AWS, etc.). It can also be used with/on SAP HANA, IoT, AI, Blockchain, and smart contracts to implement supply chain visibility, and other SC related solutions, etc.
We believe the above points are still valid. Here are some evidences:
- We studied the top skills in analytics jobs & Python was among the top skills.
- Python is among the top skills for data analysts (Skill number 4 in the list): https://www.indeed.com/career-advice/resumes-cover-letters/skills-for-data-analyst
- https://www.coursera.org/articles/in-demand-data-analyst-skills-to-get-hired
- The visualization libraries in Python can produce the kind of visualizations not available in Tableau & Power BI. Students will be able to differentiate themselves from other schools.
- Python graphing libraries that help in creating live and highly customized plots. It is possible to use Python or R in Tableau and Power BI to develop advanced plots. To use Python and R in Tableau and Power BI, students should first learn Python syntax and libraries.
- Tableau & Power BI recently added Python or Python+Jupyter because certain Python analytics & visualization are not available in Tableau and Power BI. Using them together makes it a powerful analytics solution (e.g., the ability to transform visualization into implementable actions).
- Here are some examples:
- TabPy makes it possible to use Python scripts in Tableau calculated fields.: https://www.tableau.com/about/blog/2017/1/building-advanced-analytics-applications-tabpy-64916
- PyCaret makes it possible to use machine learning in Tableau: https://towardsdatascience.com/machine-learning-in-tableau-with-pycaret-166ffac9b22e
- Python can create machine learning modules and create the visualization based on the predicated result.
- All data scientists stress the importance of Python in analytics programs. Note, “data scientist” is one of the fastest growing career paths with escalating salaries because not enough people are good at this stuff.
- Python are “R” are both number one & two in analytics, but Python is easier to learn compared to R.
- I believe learning python is easier. Also, because python is a multi-purpose language compared to R, students could benefit more from learning Python.
- Past experience in our SCM program (3+ semesters of experience in CIS 2650) shows that non-technical students (SCM, marketing, accounting, etc.) are able to handle the content that we designed.
- I believe it’s still valid.
- Python + Jupyter (or its variant) are used in Big Data (Hadoop, Microsoft Azure, Amazon AWS, etc.). It can also be used with/on SAP HANA, IoT, AI, Blockchain, and smart contracts to implement supply chain visibility, and other SC related solutions, etc.
- It’s still completely valid. https://towardsdatascience.com/why-is-python-programming-a-perfect-fit-for-big-data-5ac54ee8f95e
To make sure students see Python’s benefits and applications, we added applications of Python in Tableau/Power BI to the course content and offer some examples.
Kevin Boyer 1st degree connection1stAssociate Director – Value Optimization at Adept Packaging (Adept Group)1moTableau is a great tool for data visualization and easy to use. Most of these tools have free trials where you can just sign up and try them out with intuitive lessons online to get someone started. No matter what discipline you’re in nowadays you’re going to have to convey information too other parties and a lot of the platforms out there make it much easier.